AI-Powered Operations for Inspired Cannabis
How three AI agents eliminated compliance chaos, optimized inventory, and automated customer engagement across 51 retail locations in 8 weeks.
The Problem
Inspired Cannabis managed 51 retail locations across British Columbia under multiple brand names – making it one of the province's largest cannabis retail networks. Despite their scale, all review data was being compiled, organized, and analyzed manually using Excel spreadsheets.
This process consumed 15—20 hours per week of management time. Store managers and regional leads – people who should have been handling higher-level operational decisions – were stuck doing data entry, manually pulling reviews from Google and other platforms, and calculating performance formulas in spreadsheets.
As the number of stores grew, so did the data burden. There was no centralized system to view how individual stores were performing, no way to compare one location against another, and no visual dashboards showing the charts and graphs leadership needed to make informed decisions. Monthly and weekly trends were invisible – nobody could tell if a store's rating was improving or declining without hours of manual digging.
- 15—20 hours/week spent manually compiling review data in spreadsheets
- Managers stuck on data entry instead of handling strategic tasks
- No centralized dashboard – data scattered across multiple platforms
- Unable to compare store performance location-to-location
- No visual charts or graphs to represent review trends over time
- Multi-brand tracking (5 brands) impossible to manage manually at scale
- Monthly and weekly performance trends completely invisible to leadership
- Review response tracking was inconsistent – no way to measure response rates
- Growing data discrepancies as store count increased from 40 to 51
The Solution
Avelle built a centralized Review Analytics Dashboard – a custom intelligence platform that replaced the entire manual spreadsheet workflow. All review data across every brand and location is now automatically synced daily, eliminating the need to check, copy, or enter reviews into spreadsheets manually.
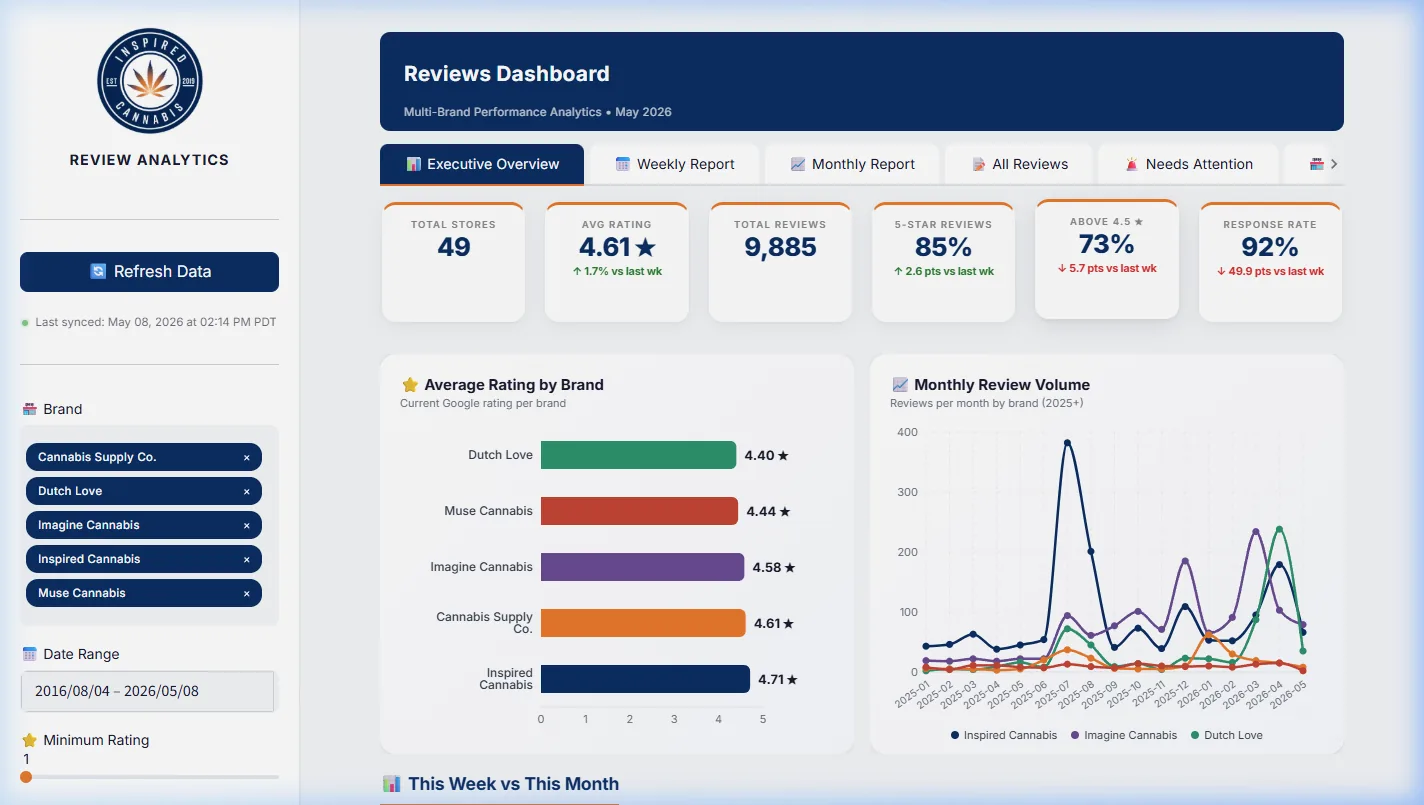
The dashboard provides 30+ custom metrics offering a wide variety of comparisons and statistical breakdowns from different data combinations – giving leadership deep insight into how each individual location is performing in terms of customer feedback.
The platform is highly interactive. Users can filter by any combination of brands, individual stores, date ranges, minimum rating thresholds, and time periods. Every chart and metric updates dynamically based on the selected filters, making it effortless to drill into any slice of the data.
Automated Daily Sync
All reviews across 51 stores and 5 brands are pulled, matched, and indexed automatically every day – zero manual entry.
Multi-View Analytics Engine
Six report views – Executive, Weekly, Monthly, All Reviews, Needs Attention, Store History – with interactive filters for brands, stores, dates, and ratings.
AI-Powered Response System
Automated brand-consistent replies with response rate tracking. "Needs Attention" flags unresponded or low-rated reviews for human follow-up.
Cross-Location Benchmarking
Volume-Adjusted Rating Change charts, 5★ vs 1★ brand breakdowns, and per-store trend grids to benchmark any location against the network.
Dashboard Deep Dive
The Executive Overview alone surfaces real-time KPIs including total reviews, average rating, 5-star percentage, and response rate – all with week-over-week and month-over-month comparisons. A Review Velocity chart tracks weekly volume against a 4-week moving average, with an interactive timeline slider for exploring historical patterns.
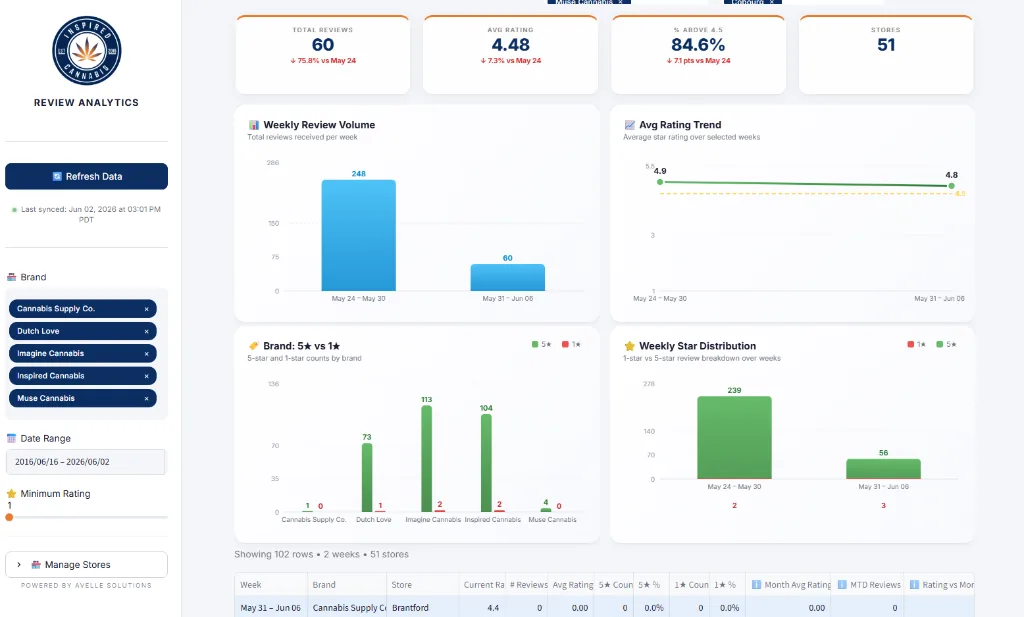
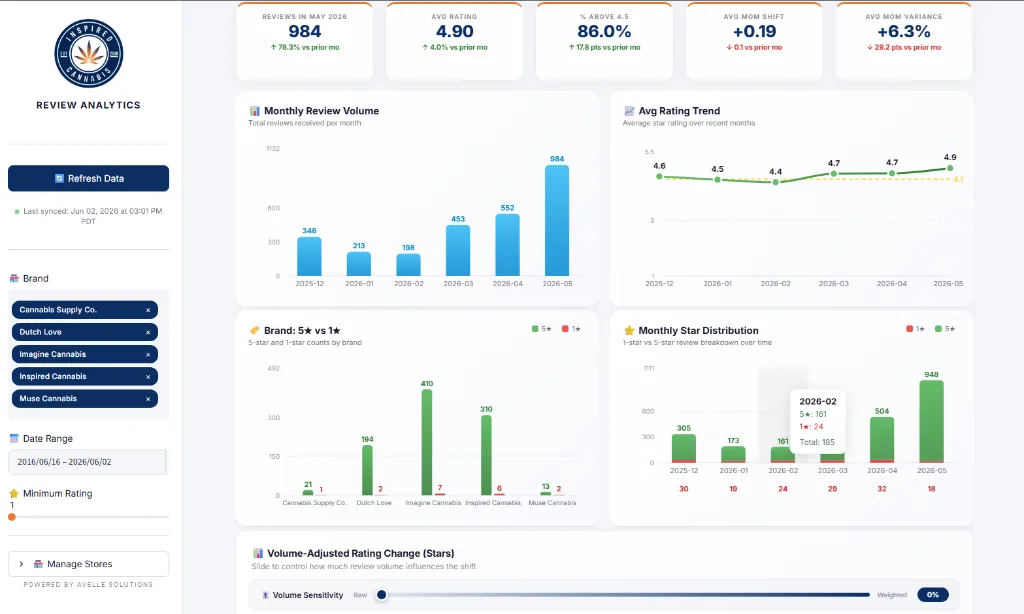
The Weekly and Monthly Reports break performance down further with brand-level 5★ vs 1★ comparisons, star distribution breakdowns over time, and a detailed store comparison grid showing every location's rating, review count, and trend vs. the monthly average.
One of the most advanced features is the Volume-Adjusted Rating Change widget – a diverging bar chart that shows per-store rating shifts, with an interactive sensitivity slider that lets leadership control how much review volume influences the calculation. This reveals which stores are truly improving vs. those boosted by low-volume noise.
The Store History view provides deep-dive profiles for any individual store – showing its rating trajectory against the brand average, monthly volume trends, star distribution over time, response rate trends, and a full review log with owner reply status.
The Results
"Avelle's AI agents transformed how we operate. What used to take our team 15 hours a week now happens automatically. Our compliance is airtight, inventory is optimized, and customers get responses in minutes instead of days. The ROI was visible within the first month."– Operations Director, Inspired Cannabis Inc.